Gender pay gap report 2017
Gender equality is a critical driver for excellence, innovation, and growth; and gender pay gap figures provide a tangible measure over time of how an institution engages with gender equality in the workplace.
There are many actions that we are taking to promote fairness and inclusivity at St Andrews: revisions to our recruitment and promotion structures; a new mentoring programme for senior academic women; implementation of flexible working patterns; and expansion of our childcare provision. However, the most fundamental change we can make is to increase transparency about gender pay differences.
I believe that by publishing our gender pay gap data and discussing what it shows and how we can most effectively deal with that, we can work to remove the gender pay gap at St Andrews and contribute to a wider socio-economic debate. Please join with me in doing that.
Sally Mapstone
Principal and Vice-Chancellor
Introduction
This is a new report on the gender pay gap at the University of St Andrews as at 31 March 2017, utilising a framework provided by the UK Government.
The University of St Andrews has published information on Gender pay by salary band since 2013, in line with the 2012 Scottish Specific Duties under the 2010 Equalities Act, as part of the biennial Equality Mainstreaming Reports.
In 2017, the UK Government introduced new regulations requiring all organisations with more than 250 staff to calculate and publish their Gender Pay Gap data.
The Gender Pay Gap is the difference between the average hourly pay of men and women across the whole organisation. It is not the same as the concept of Equal Pay which means that men and women in the same organisation are paid the same rate for like work as set out in the Equality Act 2010.
Although these new regulations do not apply to employers in Scotland and Wales, the University of St Andrews has produced a gender pay analysis, which is published on the UK Government’s dedicated website, that will allow direct and meaningful comparison with those organisations, including almost 200 universities.
The information in this report provides the mean and median gender pay gaps for the organisation as a whole, and broken down by grade. Figures have been calculated using the technical specifications set out by the UK Government Equalities Office and are not directly comparable with the previously published figures. Historically, the University published gender pay gap data by grade, and used a methodology that looked at basic annual salary, as opposed to the hourly rates of pay required by the UK Government guidelines. The latter also require the University to take into account allowances, pay for leave, and any salary sacrifice payments being deducted.
Findings
The University’s gender pay gap figures as at 31 March 2017 are as follows:
Mean gender pay gap
Male
![]()
1,731 staff
£19.94 per hour
Female
![]()
1,838 staff
£15.29 per hour
23.3%
The mean, hourly rate is calculated by adding all of the hourly rates together and dividing by the number of individuals in the data set.
The pay gap is the average difference between the mean hourly pay rate of men and women.
Median gender pay gap
Male
![]()
1,731 staff
£16.98 per hour
Female
![]()
1,838 staff
£13.77 per hour
18.9%
The ‘median’ hourly rate is calculated by arranging the hourly rates of all individuals in the data set in numerical order to identify the middle (or median) hourly rate.
50% of individuals will earn more than this hourly rate and 50% will earn less.
The median gender pay gap is the difference between the mid-point hourly pay rate of men and women.
Proportion of women in each pay quartile
- Lower quartile: 64.3% female, 35.7% male
- Lower middle quartile: 56.2% female, 43.8% male
- Upper middle quartile: 49.3% female, 50.7% male
- Upper quartile: 36.1% female, 63.9% male
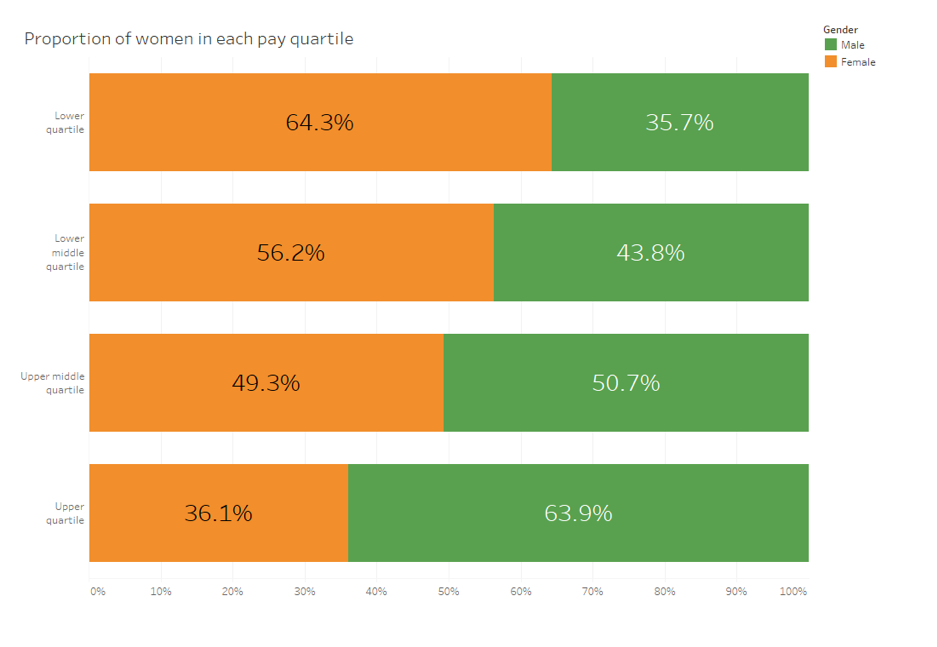
Quartile pay bands are calculated by dividing the overall staff population into four equal segments from lowest to highest hourly pay.
This figure shows the percentage of men and women in each quartile.
Bonus payments
The University has no contractual bonus arrangements.
What the figures tell us
The University has undertaken an analysis by contract type and grade to provide a more granular overview of the data. These figures are shown in tables at the bottom of this page.
The figures identify a mean gender pay gap of 23.3% and a median gender pay gap of 18.9%. These figures compare with an average mean gender pay gap of 21.1% and median gender pay gap of 17.1% for English Russell Group universities. According to the October 2017 ONS Annual Survey of Hours and Earnings (ASHE) figures, the median gender pay gap for the UK economy as a whole is 18.4%.
The pay gaps identified mainly derive from a disproportionately small number of women in more senior University roles. Over 64% of staff in the lower pay quartile are women, and only 36% in the upper quartile. The middle quartiles are closer in gender distribution.
Actions to address the gender pay gap
The University is committed to removing the gender pay gap over time, and is taking the following actions:
- Recruitment and promotion procedures have been revised to encourage applications from women and other underrepresented groups, take positive steps to prevent single sex shortlists, and require mandatory unconscious bias and diversity training for recruitment and promotion board members.
- Continued commitment to Athena SWAN; the University’s Bronze institutional award was renewed in 2018; 42% of our Academic Schools have achieved an Athena SWAN award and those remaining are on target to submit by 2019.
- The introduction of Professorial pay banding and a more structured salary review for senior staff.
- A review of family friendly policies is under way, with the implementation of core meeting hours across all schools to allow flexible start and finish times to support employees with caring responsibilities.
- A Carers Support Network has been established to provide a fora for discussion and engagement and to support the University’s commitment to Carer Positive.
- The Elizabeth Garret mentoring programme has been launched to support women in, or aspiring to, academic leadership roles.
- The University has sponsored 49 future academic leaders on the Aurora programme.
- A Gender, Diversity and Inclusion Research Fund has been established and is currently supporting 14 projects to generate further evidence to support good practice.
- A working group has been established with the recognised Trade Unions to build our understanding of the factors driving the gender pay gap and identify possible further actions.
These actions are the starting point for addressing gender pay differentials within the University. The University, through its Strategic Plan and through annual reporting, is committed to making progress rapid, meaningful, and visible.
Annual report 2019 (PDF)
Gender pay gap by contract type
Mean
| Contract | Male | Female | Percentage | Population size |
|---|---|---|---|---|
| Academic | £33.75 ph | £29.46 ph | 12.7% | 18% (644) |
| Academic research | £19.93 ph | £18.82 ph | 5.5% | 10.1% (359) |
| Academic teaching | £20.72 ph | £20.28 ph | 2.1% | 3.9% (140) |
| Bank | £11.48 ph | £10.79 ph | 6.1% | 25% (893) |
| Casual | £10.44 ph | £9.68 ph | 7.3% | 0.9% (32) |
| Managerial, Specialist and Administrative | £19.89 ph | £15.28 ph | 23.2% | 24.4% (871) |
| Operational and Facilities | £10.79 ph | £9.57 ph | 11.3% | 13.3% (473) |
| Technical and Experimental | £15.29 ph | £13.52 ph | 11.6% | 4.4% (157) |
Gender pay gap by contract type
Median
| Contract | Male | Female | Percentage | Population size |
|---|---|---|---|---|
| Academic | £29.60 ph | £26.31 ph | 11.1% | 18% (644) |
| Academic research | £18.56 ph | £17.94 ph | 3.3% | 10.1% (359) |
| Academic teaching | £20.19 ph | £19.03 ph | 5.7% | 3.9% (140) |
| Bank | £11.59 ph | £8.47 ph | 26.9% | 25% (893) |
| Casual | £8.45 ph | £8.45 ph | 0.0% | 0.9% (32) |
| Managerial, Specialist and Administrative | £19.03 ph | £13.37 ph | 29.7% | 24.4% (871) |
| Operational and Facilities | £9.46 ph | £8.42 ph | 11.0% | 13.3% (473) |
| Technical and Experimental | £15.04 ph | £13.77 ph | 8.4% | 4.4% (157) |
Gender pay gap by grade
Mean
| Grades | Male | Female | Percentage | Population size |
|---|---|---|---|---|
| Grade 1 | £8.43 ph | £8.47 ph | -0.5% | 6.8% (242) |
| Grade 2 | £9.12 ph | £8.90 ph | 2.5% | 4.8% (170) |
| Grade 3 | £10.44 ph | £10.61 ph | -1.6% | 6.9% (248) |
| Grade 4 | £12.71 ph | £12.57 ph | 1.1% | 5.0% (180) |
| Grade 5 | £15.65 ph | £15.37 ph | 1.8% | 7.8% (278) |
| Grade 6 | £18.68 ph | £18.31 ph | 2.0% | 15.1% (540) |
| Grade 7 | £24.09 ph | £23.83 ph | 1.1% | 12.7% (455) |
| Grade 8 | £29.15 ph | £28.51 ph | 2.2% | 6.7% (239) |
| Grade 9 | £44.57 ph | £41.58 ph | 6.7% | 6.2% (221) |
| Bank/Casual | £11.45 ph | £10.75 ph | 6.1% | 25.9% (925) |
| Bespoke/NHS | £29.22 ph | £30.78 ph | -5.3% | 2.0% (71) |
Gender pay gap by grade
Medain
| Grades | Male | Female | Percentage | Population size |
|---|---|---|---|---|
| Grade 1 | £8.42 ph | £8.42 ph | 0.0% | 6.8% (242) |
| Grade 2 | £9.32 ph | £8.88 ph | 4.7% | 4.8% (170) |
| Grade 3 | £10.30 ph | £10.90 ph | -5.8% | 6.9% (248) |
| Grade 4 | £12.62 ph | £12.62 ph | 0.0% | 5.0% (180) |
| Grade 5 | £15.04 ph | £14.61 ph | 2.9% | 7.8% (278) |
| Grade 6 | £18.48 ph | £17.94 ph | 2.9% | 15.1% (540) |
| Grade 7 | £24.78 ph | £24.01 ph | 3.1% | 12.7% (455) |
| Grade 8 | £29.60 ph | £28.82 ph | 2.6% | 6.7% (239) |
| Grade 9 | £42.64 ph | £39.62 ph | 7.1% | 6.2% (221) |
| Bank/Casual | £11.59 ph | £8.47 ph | 26.9% | 25.9% (925) |
| Bespoke/NHS | £24.74 ph | £23.63 ph | 4.5% | 2.0% (71) |