Gender pay gap report 2024
This is the eighth report on the gender pay gap at the University of St Andrews, utilising a framework provided by the UK Government.
Key points
- The mean gender pay gap has decreased to 16.9% in 2024 from 17.6% in 2023.
- The median gender pay gap has increased to 15.0% in 2024 from 12.9% in 2023.
- The mean gender pay gap for those staff on the University grade scale is 2.0% or less for each individual grade, except for Grade 9 (9.7%). The gap for Grades 2 and 7 is in favour of women.
- The median gender pay gap for those staff on the University grade scale is 1.0% or less for each individual grade, except for Grade 9 (8.6%) and Grade 4 (2.4%). The gap for Grades 2, 5, and 8 is in favour of women.
- The main drivers of gender pay gap are the distribution of staff (with women forming a majority of staff at the lower paid grades and minority of staff at the higher paid grades) and the difference in pay at Grade 9.
Introduction
Equality, diversity, and inclusion is a core pillar in the University Strategy. The University is committed to promoting inclusivity and providing equal opportunity for all of its staff and students.
The University was first awarded an institutional Athena Swan Bronze Award in 2013, and was awarded an Athena Swan Silver Award in 2024, which recognised our commitments and achievement in addressing gender equality issues. All our academic schools hold a school level Athena Swan Award including one Gold and five Silver.
This is our eighth report on the gender pay gap. We continue to monitor our gender pay gaps, work to understand reasons for pay differentials, and strengthen our actions to address gender imbalance in recruitment and promotion in order to reduce the gender pay gap (see Closing the gap).
We adopt a framework provided by the UK Government in calculating gender pay gap. The gender pay gap is a measure of the difference between the average hourly pay of men and women across the whole organisation. It is not a measure of unequal pay, which is the difference in pay between men and women doing the same job. Unequal pay is against the law, as set out in the Equality Act 2010.
This analysis is based on our payroll data as at 31 March 2024. This report focuses on the gender pay gap. Our ethnicity pay gap report is available online, and further analysis will be conducted to assess the disability pay gap among the 2024 population.
Key findings on gender pay gap
The population
As at 31 March 2023, there were 4,231 staff members who were on the University payroll and who met the UK Government’s definition for inclusion in the gender pay gap population. This population includes staff on both salaried and flexible contracts, standard and fixed term, and full-time and part-time hours. Of the total 4,231 staff members, 53.9% (2,281) were female and 46.1% (1,950) were male (Figure 1).

Figure 1: Staff population by gender, 2024
Overall gender pay gap 2024
The gender pay gap is the percentage difference between the average hourly rate for male staff and female staff.
Our mean gender pay gap for 2023 is 16.9%. This means the mean average hourly pay for a man is 16.9% higher than for a woman.
Our median gender pay gap for 2023 is 15.0%. This means if you arrange all the women and all the men in order by their hourly rate, the hourly rate for the middle woman is 15.0% lower than that for the middle man.
Trends in gender pay gap
The overall mean gender pay gap has been declining since our first report in 2017 (Figure 2). It has fallen by 6.5 percentage points between 2017 and 2023. The mean gender pay gap is 0.7 percentage points lower than in 2023.

Figure 2: Mean gender pay gap, 2017 to 2024
| Year | All | Academic | Professional Services |
|---|---|---|---|
| 2017 | 23.3% | 15.3% | 13.2% |
| 2018 | 22.6% | 15.5% | 12.1% |
| 2019 | 21.9% | 16.1% | 11.3% |
| 2020 | 20.7% | 14.2% | 11.2% |
| 2021 | 20.2% | 16.1% | 10.1% |
| 2022 | 17.6% | 13.4% | 6.9% |
| 2023 | 17.6% | 12.9% | 7.4% |
| 2024 | 16.9% | 13.9% | 5.9% |
The mean gender pay gap for salaried (i.e. excluding flexible contracts and Graduate Teaching Assistants) academic staff of 13.9% has widened from 2023, but remains lower than 2017. This widening is due to the increase in the numbers and proportions of women in academic posts at grade 6 and below. For salaried professional services staff, the gap has decreased slightly to 5.9%.

Figure 3: Median gender pay gap, 2017 to 2024
| Year | All | Academic | Professional Services |
|---|---|---|---|
| 2017 | 18.9% | 11.1% | 16.2% |
| 2018 | 21.0% | 11.1% | 16.2% |
| 2019 | 16.6% | 13.7% | 15.1% |
| 2020 | 15.1% | 9.5% | 14.9% |
| 2021 | 18.1% | 16.1% | 10.9% |
| 2022 | 14.9% | 13.7% | 6.3% |
| 2023 | 12.9% | 10.9% | 9.9% |
| 2024 | 15.0% | 13.7% | 5.9% |
The median gender pay gap has widened back to 15.0%. This is because of an increase in the number of women in posts at grade 5 and below, as well as in flexible contracts which are typically lower paid. The salaried academic gender pay gap has also increased, due to an increase in women in posts at grade 6 and below. The salaried professional services median gap has decreased to 5.9%, its lowest point since 2017.
Gender pay quartile
There are a higher proportion of women (compared to men) in the lower, lower middle, and upper middle pay quartiles. There is a higher proportion of men in the upper pay quartile. This vertical segregation of men and women is the key driver of both the mean and median gender pay gaps.

Figure 4: Gender distribution in each quartile, 2024
Gender pay gap UK benchmarks
The mean gender pay gap for the UK is currently 13.8%, with the median pay gap at 13.1% (ONS, Gender pay gap in the UK: 2024). As gender pay gaps vary by industry, UCEA produce an annual report on higher education institutions’ pay gaps. St Andrews’ mean gender pay gap is larger than the gap for UK HEIs, and at the same level as Russell Group institutions.

Figure 5: St Andrews mean pay gap benchmarked
*UCEA data as at 31 March 2023
St Andrews’ median gender pay gap is wider than the gap for UK HEIs, and also wider than the Rusell Group’s median pay gap.

Figure 6: St Andrews median pay gap benchmarked
*UCEA data as at 31 March 2023
AdvanceHE produce gender pay gap data for salaried academic and professional services staff across all UK higher education institutions. St Andrews’ mean and median gender pay gaps for salaried academic staff are larger than those for the sector. Our mean gender pay gap for salaried professional services staff is slightly larger than the sector gap, however our median gap is smaller.

Figure 7: St Andrews mean academic and professional services pay gaps benchmarked
*AdvanceHE data as at 2022-23
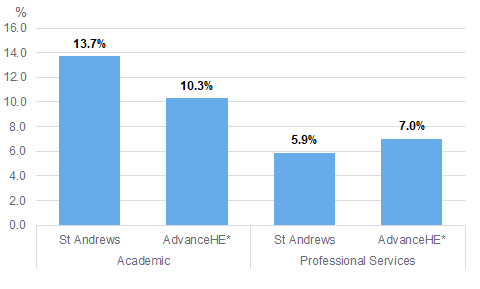
Figure 8: St Andrews median academic and professional services pay gaps benchmarked
*AdvanceHE data as at 2022-23
Gender pay gap by grade
Most salaried staff of the University are employed on a 9- point grade scale, details of which can be found on the University’s website.
The highest paid grade, Grade 9 has historically seen significant gender pay gaps. Our highest mean and median gaps were recorded in 2022 at 12.2% and 12.4%. The Grade 9 mean gap is now 9.7% (compared with 9.5% in 2023), whilst the median gap has seen improvement to 8.6% (from 9.8% in 2023).

Figure 9: Mean Grade 9 gender pay gap, 2017 to 2024
| Year | All | Academic | Professional Services |
|---|---|---|---|
| 2017 | 6.7% | 4.0% | 24.4% |
| 2018 | 7.7% | 4.4% | 25.4% |
| 2019 | 11.8% | 9.9% | 22.3% |
| 2020 | 10.9% | 8.6% | 23.0% |
| 2021 | 10.4% | 8.2% | 23.1% |
| 2022 | 12.2% | 10.0% | 24.6% |
| 2023 | 9.5% | 9.1% | 13.5% |
| 2024 | 9.7% | 10.7% | 6.7% |
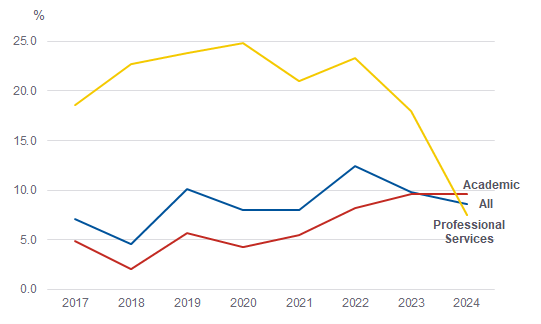
Figure 10: Median Grade 9 gender pay gap, 2017 to 2024
| Year | All | Academic | Professional Services |
|---|---|---|---|
| 2017 | 7.1% | 4.8% | 18.6% |
| 2018 | 4.6% | 2.1% | 22.7% |
| 2019 | 10.1% | 5.6% | 23.8% |
| 2020 | 7.9% | 4.2% | 24.9% |
| 2021 | 8.0% | 5.5% | 21.1% |
| 2022 | 12.4% | 8.2% | 23.4% |
| 2023 | 9.8% | 9.6% | 18.0% |
| 2024 | 8.6% | 9.6% | 7.5% |
These gaps are driven by the fact that a much higher proportion of women are in the lowest paying Band A of Grade 9 compared with men, which can be seen in Figure 11.
The mean and median pay gap for academic Grade 9 staff are 10.7% and 9.6% respectively. Both the mean and median academic Grade 9 gender pay gaps have grown since 2017 (Figures 9 and 10). This is a result of the actions we have taken to improve the representation of women in the professoriate, as newly promoted Professors are appointed into Band A.
The pay gap for professional service staff at Grade 9 is now smaller than for academic staff (Figure 9 and 10). The mean gap is 6.7% and median gap is 7.5%. The number of professional services staff at Grade 9 is relatively small (34 staff in 2024), meaning that a small number of changes can have a large impact on the size of the gap.
| Grade 9 band | Men | Women |
|---|---|---|
| Legacy | 17.9% | 4.7% |
| Band A | 43.2% | 64.0% |
| Band B | 23.7% | 22.1% |
| Band C | 15.3% | 9.3% |
Note: In 2017 the University introduced a sub-grade pay banding structure within Grade 9 (i.e., 9A, 9B, and 9C). Staff are moved to the new structure during the pay review process, but some staff remain on legacy Grade 9 pay points.
The mean gender pay gaps by grade for Grades 1 to 8 are 2.0% or less, and in some cases (Grade 2 and 7) are in favour of women. The median gender pay gaps by grade for Grades 1 to 8 are also low, at less than 1%, save for Grade 4 where it is at 2.4% or less. At Grades 2, 5, and 8 the gap is in favour of women.
The mean gender pay gap for all staff on Grades 1 to 8 inclusive is 10.4%, whilst the median gap is 14.5%. This tells us that even outwith Grade 9 we see more men in the higher paid grades, and more women in the lower paid grades.