Matrix view
If a data file contains a largeWhat constitutes 'large' depends on your screen resolution, but is probably any value greater than about 10. number of traces, it is difficult to display them all on separate axes in the standard Chart view because the vertical axes become so compressed that each trace looks more-or-less like a flat line. Furthermore, the scale values on the axes cannot be read because the edit boxes overlap. The Matrix view shows the traces as a series of "thumbnail" tiles arranged in a grid. This can give a clearer view of the individual traces, while keeping them on separate axes.
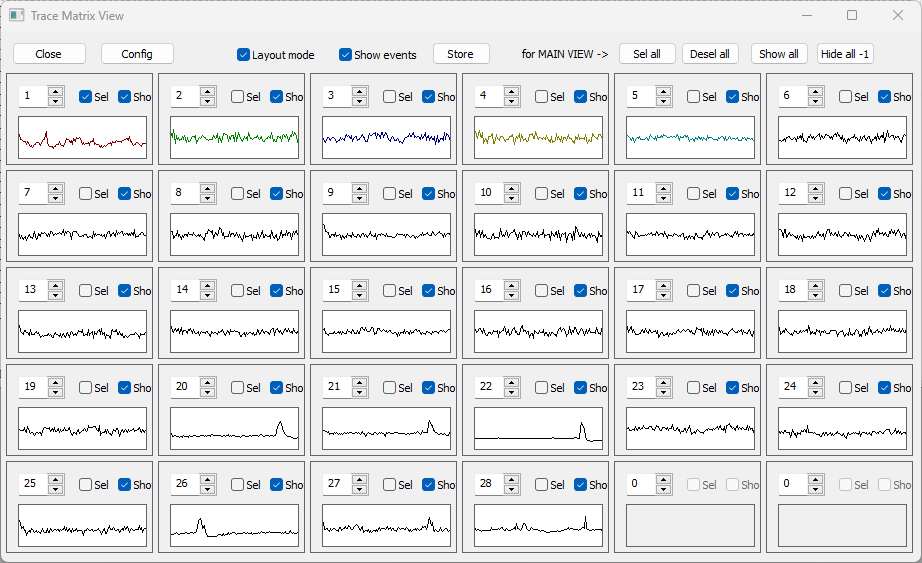
- Load the file calcium imaging.
This is a 28-trace optical recording of calcium fluorescence, and with this many traces it is hard to see what is going on in the standard chart view. - Select the View: Matrix view menu command.
This opens the Matrix View. However, since this file has not previously been viewed as a matrix, the view needs to be configured, and the Configure Trace Matrix View dialog opens automatically.
- Set the matrix dimensions to 5 rows and 6 columns.
- The default layout is a square matrix large enough to hold all the traces, but since there are 28 traces, set Rows to 5 and Columns to 6.
- Click OK to dismiss the Configure dialog.
- You can re-configure the view at any time by clicking the Config button.
If you immediately Close the matrix view, and then select View: Matrix view to re-display the view, the view retains the settings of the previous configuration. However, if you want this configuration to persist after closing the file, you must save the file itself after matrix view configuration. If you edit the cell display within the Matrix view, then you must click Store within the view to retain the edited settings.
- With the matrix view open, drag on a corner of the window to increase its size. You can now see all 28 traces, each displayed in its individual cell. The last 2 cells are empty, because there are 30 cells and only 28 traces.
- Uncheck the Layout mode box, and then re-check it.
- With Layout mode unchecked you can see more of the data, but some editing options are hidden.
Timebase and Gain
The timebase of cells in the matrix view is linked to the main view.
- Click the Expand timebase button (
 )in the main view toolbar.
 - Note that the timebase changes in both the Matrix view and the main Chart view.
- Reverse by clicking the Compress timebase button (
 ).
).
The trace gain of matrix cells is linked to the axis gain in the main view, but the latter cannot easily be selected or edited due to the vertical compression.
- Check the Sel box for the matrix cell holding trace 15 (3rd down, 3rd from left).
- This selects axis 15 in the Chart view, although you cannot see this.
- Click the Gain up button (
 ) in the main view toolbar 6 times.
 - The gain of the trace in the cell, and on axis 15 in the main view, increases.
- Reverse by clicking the Gain down button (
 ).
).
"Interesting" traces
It is apparent that some traces are mainly noise (e.g. traces 2, 3, 4 etc.) while some traces contain an obvious signal (e.g. traces 20, 21, 22 etc.). This was by no means clear in the standard chart view.
- Click Hide all -1.
The Show box in each matrix cell except that of trace 1 becomes unchecked, and in the main view all the traces are hidden except for trace 1. - Check the Show boxes in cells 20, 21, 22 and 26, then uncheck the box for cell 1.
The main Chart view now only shows traces which contain a clear signal. The view is now more suitable for further analysis.