Trace arithmetic
DataView includes an arithmetic expression parser that allows the user to transform data by applying a user-defined formula to an existing or new trace on a sample-by-sample basis.
The Transform: Trace arithmetic command transforms an existing channel and either replaces it, or adds a new channel immediately below it.
The Transform: New trace command always generates a new trace which is placed below all the other traces.
The File: New: User defined command generates a new file with a single trace. You set the file name, the number of samples in the trace and the sample interval. You also specify a formula (which could be simply "0") to define the trace contents.
Formulae
The formula is applied to each sample in a trace in turn.
Within the formula expresssion the variables x1 - x128 represent the data values of traces 1 - 128 at that sample bin, while the variable xt represents the time at that sample. A full description of the formula syntax (functions and operators) is given here.
Random numbers
The expression parser can generate random numbers from a variety of distributions.
The function rndu() generates a random number x drawn from a uniform distribution such that 0 <= x < 1.
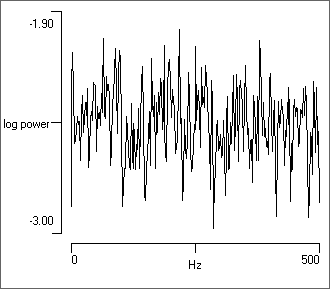
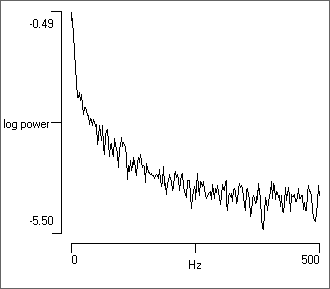
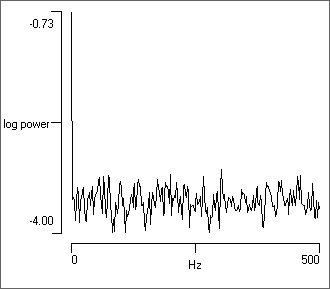
The function rndn() generates a random number x drawn from a normal (Gaussian) distribution with mean of 0 and standard deviation of 1. To convert this to a number from a distribution with mean m and standard deviation s, simply enter (m + s*rndn()) where m and s are replaced by the desired actual numbers. If written as successive samples in a trace, this generates white noise (where all frequencies have equal power).
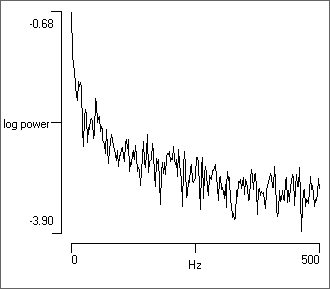
The function rndp() generates a random number x drawn from a "pink" noise (1/f noise) distribution with an approximate mean of 0 and standard deviation of 1. Pink noise has power at each frequency that is inversely proportional to the frequency. This means that pink noise has more low frequency components than white noise.
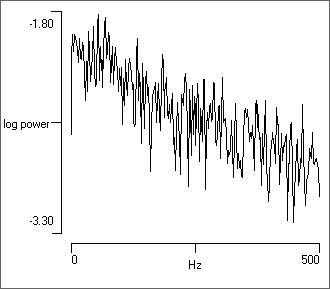
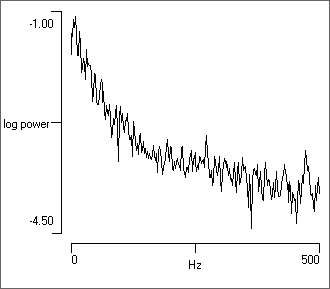
The function rndo(t) generates random numbers according to an Ornstein-Uhlenbeck stochastic process with a time constant t. This effectively generates exponentially-filtered white noise (Linaro et al., 2011), so there is autocorrelation in which successive samples depend to a greater or lesser extent on the value of the previous sample, with the extent determined by the time constant. Another way to think of the OU distribution is that it is a modified random walk, in which the next value is a random deviation from the previous value. The modification is that there is a tendancy for the walk to move towards a central location, and the further a value is from that centre, the stronger is the attraction back to the centre.
- Load the file random.
- Select the Analyse: Power spectrum menu command to open the Power Spectrum dialog (see here for details).
- Set the Trace ID from 1 to 6 to see the spectrum produced by the various random number generators.
User-Defined Trace
- Select the File: New: User defined menu command to open the New file dialog.
- Enter “sin(xt/10)” into the expression edit box (you can copy and paste from this page)
- Click OK.
- Enter a new file name when requested.
- When the new file loads, click the Autoscale toolbar button (
 ).
).
Observe that the trace has shows a sine wave. The formula that you entered means that a trace is written in which each value is given as the sine of the current time within the record divided by 10. This formula is visible as the label of the new trace.
- Select the Transform: New trace menu command to open the New trace dialog.
- Enter “sin(xt/50)” into the expression edit box.
- Uncheck the write new file box.
- Click OK.
- Hold down the control key and click the Autoscale toolbar button () again.
You will now see an additional trace containing a sine wave of a somewhat lower frequency.
- Repeat the New trace command sequence above, entering “fmod(xt,500)/500” as the expression. This should give you a sawtooth waveform.
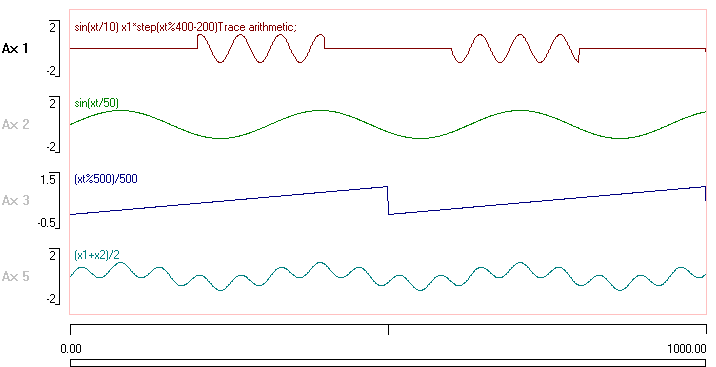
- Repeat the New trace command sequence above, entering “(x1+x2)/2”. This should give you a channel that is the average of the two sine waves.
- Select the Transform: Trace arithmetic menu command to open the Trace Arithmetic dialog.
- Check the replace trace option, leaving the Replace/add target as 1. This means that trace 1 will be replaced by the result generated by the formula.
- Enter “(fmod(xt,400) -200) >= 0 ? x1 : 0” ino the expression box.
- Uncheck Write new file.
- Click OK.
- Hold down the control key and click the gain down toolbar button (
 ). (This just moves the traces away from the trace labels slightly.)
You should end up with a display that looks like this:
This exercise should give you some idea of how to use the arithmetic facilities of Dataview (although it is not obvious why anyone would want to carry out the operations described…)