Oscillator phase reset test (interval predictor)
A common task when investigating rhythmic activity is to determine whether an experimental perturbation changes the phase of subsequent cycles of activity. The reason this is important is that a change in phase implies that the experiment affected the rhythm generating (oscillator) mechanism itself, rather than something that was simply driven by the oscillator. DataView contains a simple facility for interval prediction that can help with this.
- Load the file reset.
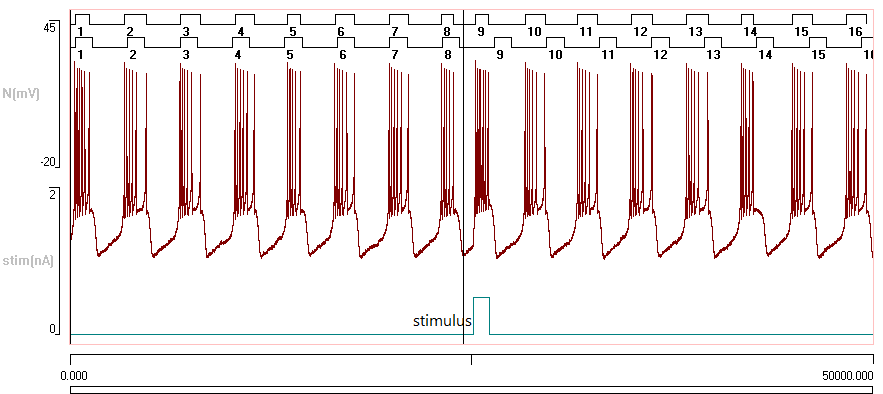
This shows a recording of a simulated endogenous burster neuron (again produced using the program Neurosim – yes, this probably is an advert). BurstsSome membrane noise was added to the simulation to increase the realism. have been detected as events using the Threshold method, with a minimum off duration (0.6 s) set to merge spikes within a burst into a single event. A stimulus pulse of positive current was injected into the neuron just after the 8th burst. The question is, has this pulse reset the phase of the oscillator?
The first thing we have to do is to tell the program which data represent the “normal” pattern of activity.
- Select the Cursors: Multi-add vert command, and place two cursors, one just before the 1st burst in the record, and one between the bursts associated with events numbered 8 and 9.
The cursors thus bracket a consecutive series of bursts prior to the perturbation. - Now select the Event analyse: Interval predictor command.
- The defaults in the dialog box are acceptable, so click the Predict button.
A new series of events are written to another channel (channel b), and these indicate the times at which bursts would have been expected, if no perturbation of the oscillator had occurred. The onset times of both real and predicted events are shown in the list within the dialog box, and can be copied to the clipboard for further analysis in external programs if desired.
Algorithm: Interval prediction works as follows. If the cursors bracket n consecutive source events immediately preceding the perturbation, the Predict button causes a series of 2n events to be written to the new prediction (destination) event channel. These new events each have a duration equal to the average duration of the n source events. The prediction events are evenly spaced, with an interval equal to the average interval of the source events. The first n events in the prediction channel are aligned with the source events so as to minimise the absolute sum of the time difference between the onset of each source event and the equivalent prediction event. The remaining n prediction events act as a predictor for when the source channel event would have occurred, if there had been no experimental perturbation of the oscillator activity.
- Select the Event analyse: 2-D scatter graph command.
- Set the Y axis to show Phase 1 in 2 (leave the X axis showing Time).
- Set channel 1 to b and channel 2 to a.
This means that you are looking at the phase of the predicted burst events relative to the actual burst events, which is more logical than the other way around.
Note that on the left hand side of the graph (before the stimulus perturbation), the phase values appear bimodal - they are either close to 1 or 0. However, due to the circular nature of phase values, both 0 and 1 indicate synchrony (see the tutorial on phase). On the right-hand side of the graph the phase has shifted to about 0.3.
- Set the scatter graph Y axis to show Phase 1 near 2.
- Uncheck the Autoscale Y box, and set the upper and lower Y axis scales to 0.5 and -0.5 respectively.
The new phase choice simply subtracts 1 from all phase values greater than 0.5, so that phase now varies in the range -0.5 to +0.5. You can now see more clearly that prior to the stimulus the source and prediction events are nearly synchronous (relative phase 0), and that after the perturbation there is a clear phase shift.
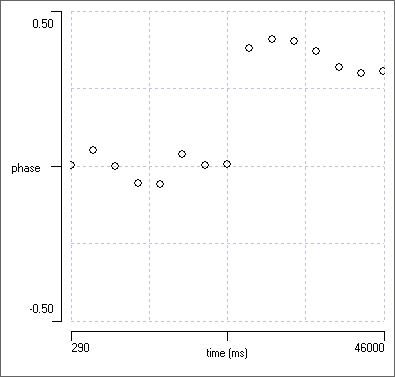
The conclusion from the analysis is that the stimulus has indeed impacted on the actual oscillator mechanism. This was obvious in this case because the data came from a simulation in which we know exactly what the mechanism is, but in a real experiment we might not know whether the neuron we stimulated was actually part of the oscillator, or merely being passively driven by a separate oscillator that we were not accessing with the stimulus. The resetting experiment indicates that the target neuron is indeed part (or all) of the oscillator.