Contents
Remove stimulus artefacts
Algorithm
Process
Detect artefacts
Match events to artefacts
Remove artefacts
Final note
Remove Stimulus Artefacts
Stimulus artefacts are a common problem when a brief pulse of current is applied as an extracellular electrical stimulus in order to evoke a response. The problem is that the recording system often picks up the stimulus itself, which thus contaminates or obscures the real activity.
- Open the file stimulus artefact.
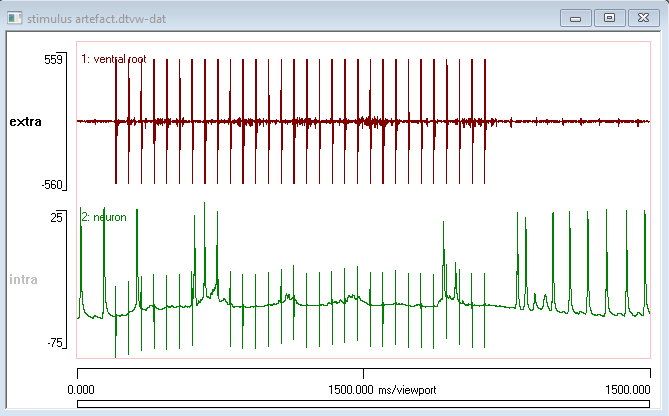
The initial view shows the entire recording. Adjusting the viewport start and end times allows the waveforms of the artefacts to be seen more clearly.
- Set the viewport start time (left-hand X axis scale) to 350 ms and the end time (right-hand X axis scale) to 420 ms.
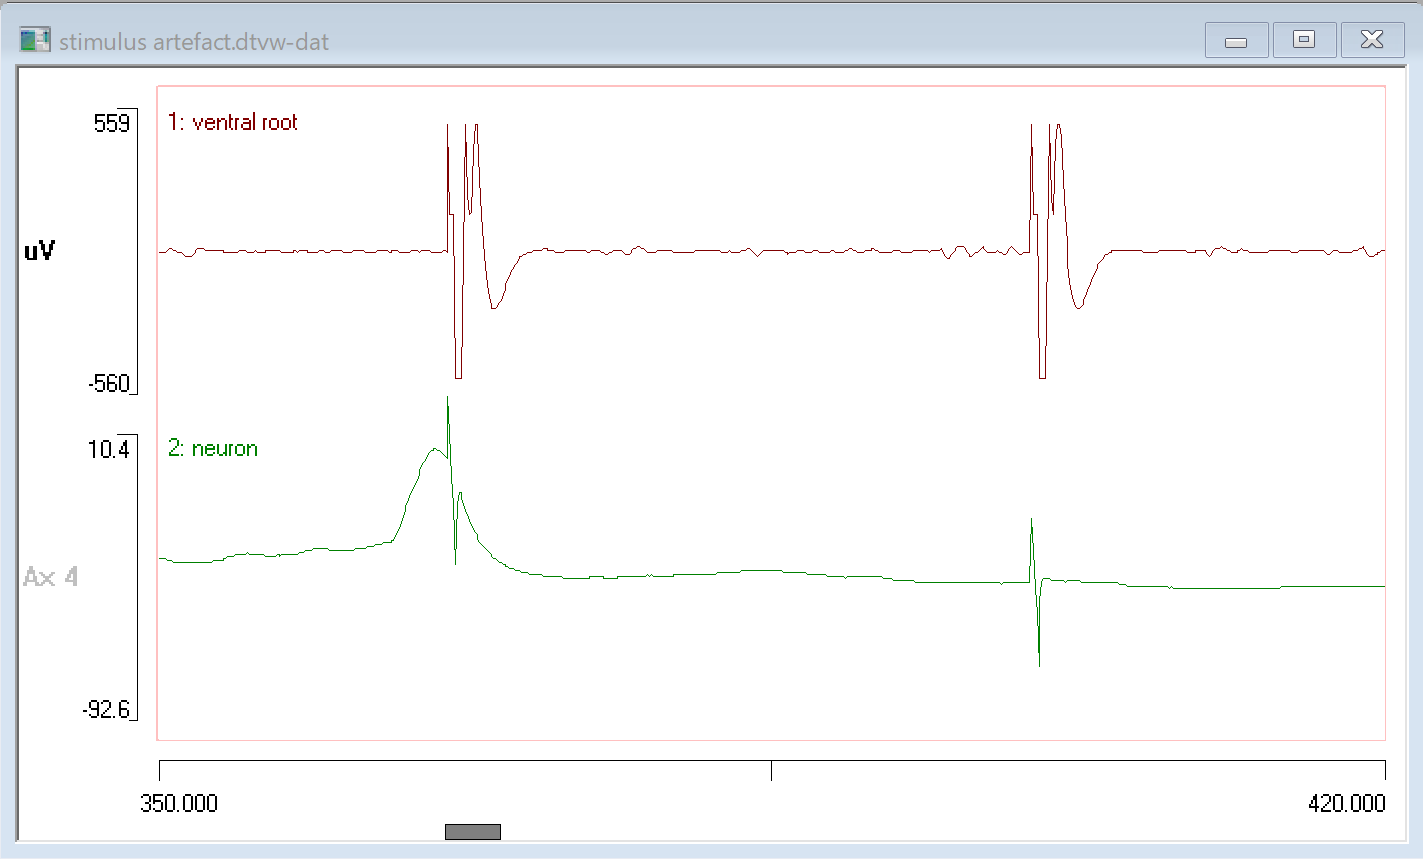
In the extracellular recording (upper trace) the artefact is so large that it dominates the visual appearance of the record. If the gain were increased in order to see the actual data, the artefact would become even larger. In the intracellular recording (lower trace) the artefact is more an aesthetic problem, but nonetheless it somewhat obscures the real data. In both cases it may be useful to remove these artefacts so that the underlying data can be seen more clearly.
Algorithm
The core algorithm is very simple:
- Detect each artefact as an event.
- Adjust the event onset times and duration so that each event completely encompass its partner artefact. Note that separate adjustments might be needed for each trace involved.
- Use the Transform: Set data value in events facility to replace the artefact with suitable data values.
Process
1: Detect Artefacts
In this recording the artefacts are synchronous in the two traces (although they differ in waveform), and so detecting them in one trace will suffice for the other trace too. However, because the challenges are different for the two traces, they will be dealt with separately for tutorial purposes.
Extracellular Recording (trace 1)
The peak-to-peak amplitude of the artefacts considerably exceeds that of the real data, and so a fairly simple threshold method can be used to detect them.
- Select the Event edit: Threshold menu command to open the Threshold dialog.
One problem is that the artefact has a moderately complex waveform with several peaks in the positive direction, so each artefact crosses a positive threshold several times in rapid succession. This could be solved by filtering the threshold detection:
- Set the Min off duration in the Time filter group to 10 ms.
- The close-together events are now merged into a single event per artefact. However, in the negative direction there is only a single peak for each artefact so we could use that without filtering.
- Reset the Min off duration to 0.
- Select -ve for the Onset direction. The red positive-threshold cursor disappears and is replaced by a purple negative-threshold cursor
- Drag the purple cursor downwards, until it is near the negative peak of the artefact.
The event monitor at the top of the dialog display should show a single event (the red U-shape) for each artefact, so that the threshold dialog looks something like this:
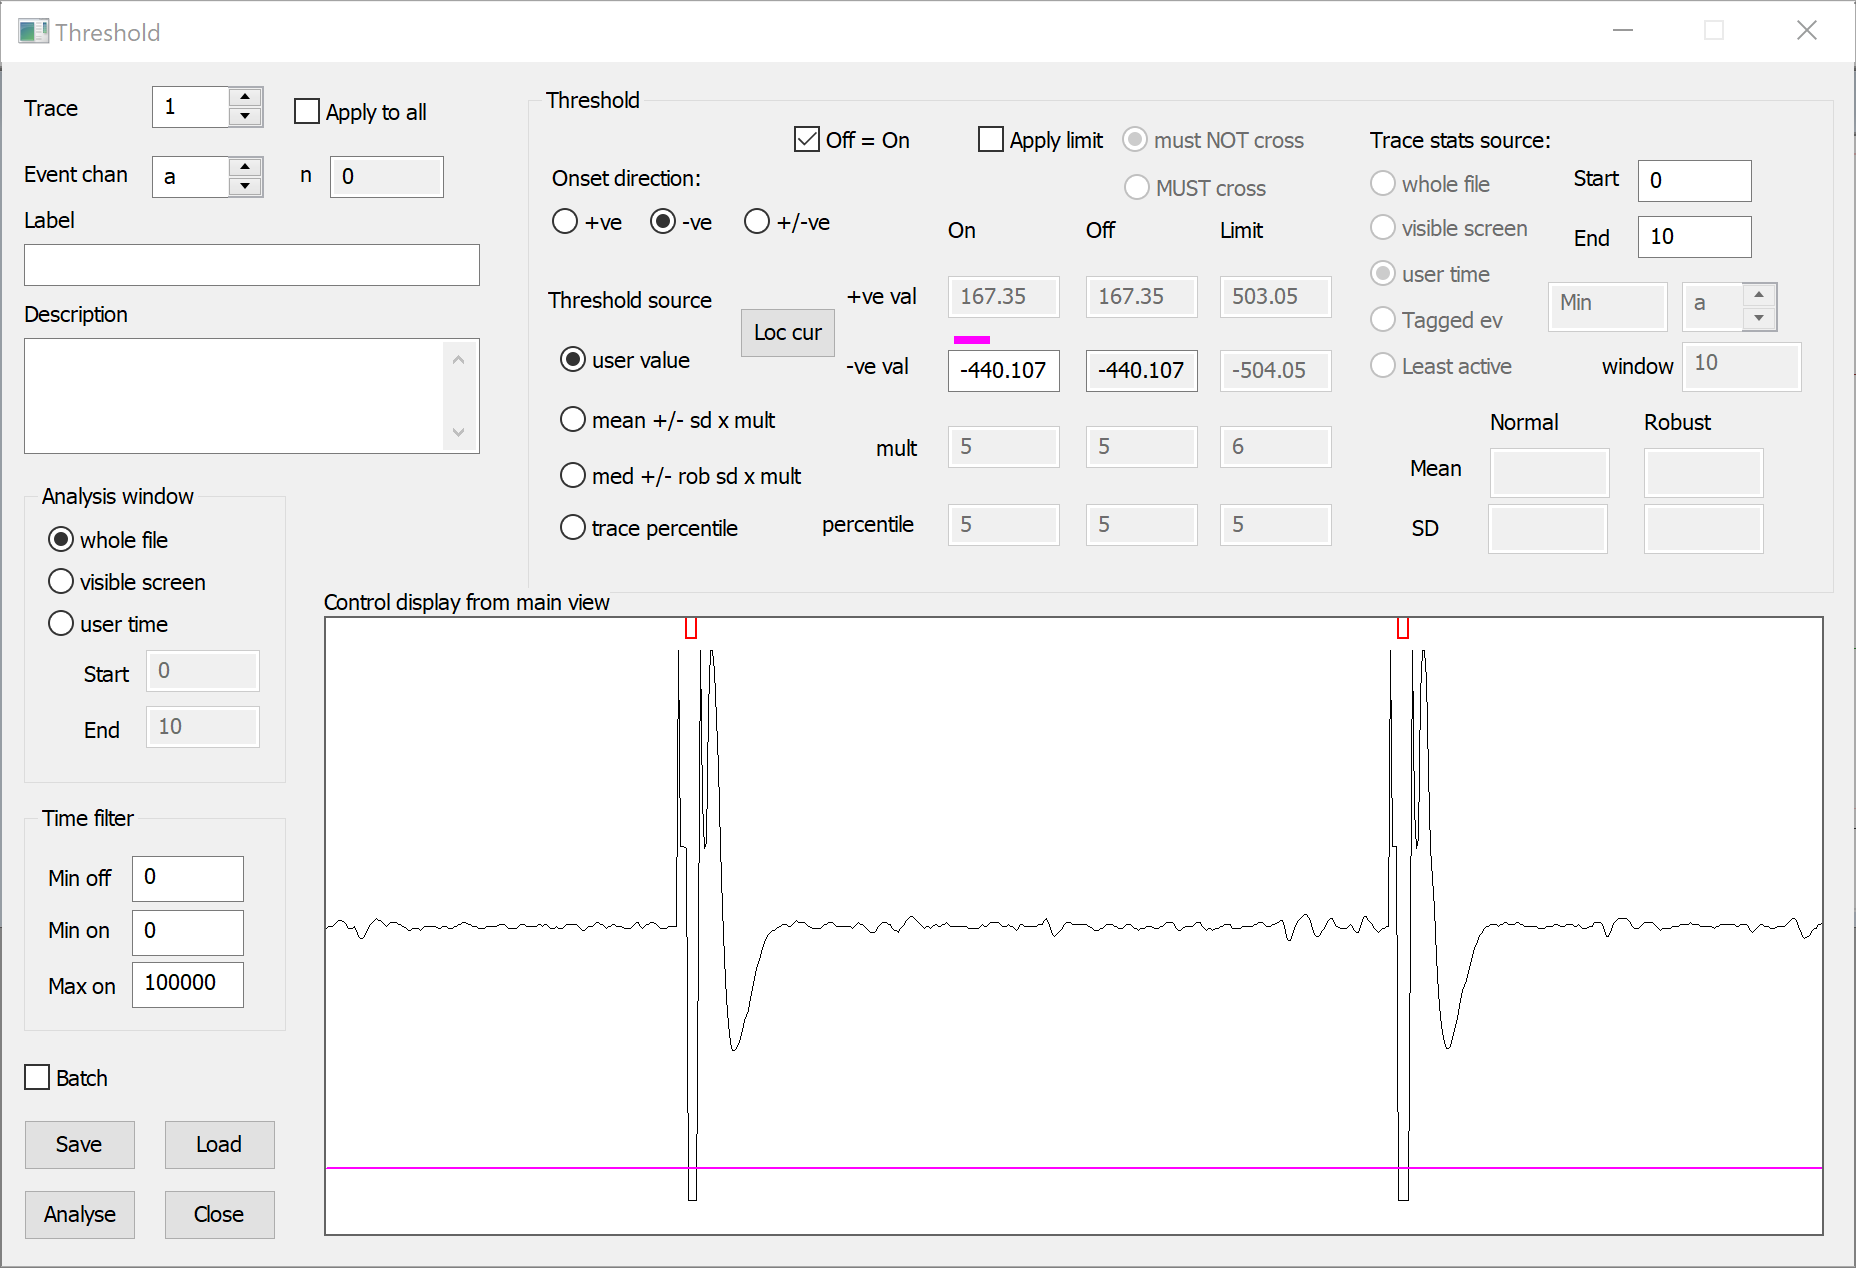
- Click Analyse to add events marking each artefact to the selected channel. Since there are no existing events, the default event channel a is suitable.
- Close the Threshold dialog.
- Click the Show all toolbar button
(
 )
in the main view to expand the timebase.
)
in the main view to expand the timebase.
Intracellular Recording (trace 2)
The intracellular recording is more challenging because the artefacts are superimposed on a varying baseline, and their peaks are sometimes below the peaks of adjacent real data (the spikes). However, the artefacts are all very brief, and so can be isolated by filtering.
- Select the Transform: Filter: RC type menu command to open the filter dialog.
- Click the Preview button in the dialog, and observe the filter effects as you set the following parameters:
- Set the Trace to process to 2.
- Note that the default High pass type is what we want, so leave this alone.
- Set the Cutoff frequency to 950 Hz. This is close to the Nyquist limit (1 KHz) set by the sample rate, so only the very highest frequency components in the data will survive the filter.
- Check the Bi-directional box.
- At this point essentially only the artefact survives in the transformed trace, so:
- Click OK and select a new file name when asked.
After the new file loads you can use the threshold method as described for the extracellular recording to detect the artefact in the new trace (3). However, there is a slight complication:
- Click the Go to start toolbar button
(
 ).
).
Note that there is an initial negative transient in trace 3 at the start of the recording, which is caused by the filter as it removes the DC component of the membrane potential. If we use a negative threshold we might pick this up as well as the artefacts, so it is therefore easier to use a positive threshold.
- Select the Event edit: Threshold menu command to open the Threshold dialog.
- It should open with b as the selected Event chan, since channel a already has events.
- The Onset direction will be in the default +ve direction.
- Set the Trace to 3.
- In the main view, click the Show all toolbar button
()
- Drag trace 3 downwards in the main view, until it is approximately in the middle of its axis range.
- In the Threshold dialog, click the Loc cur button to bring the positive threshold cursor into view.
- Drag the threshold cursor until it is just below the tops of the artefact.
- Click Analyse, and then Close the threshold dialog.
You should now have 30 events in both channels a and b. The events should be synchronized relative to each other, although the start times and durations will differ in the two channels. Either event channel could be used for the next stage in the process.
Tidy up
The following is not essential, but it makes the next stage easier to follow.
- Delete trace 3 by right clicking on it, and selecting Del trace from the context menu.
- Uncheck the Write new file box in the Delete traces dialog, since we already are working on a new file.
- Delete event channel b by right clicking on its baseline, and selecting Del event channel from the context menu.
You should now be back where you were after detecting the artefacts in the extracellular trace.
2: Match Events and Artefacts
Having got events that mark the location of each artefact, the next task is to make events that match the artefacts in start time and duration. Because the artefacts differ in the two traces, we need separate event channels for each.
- Select the Event edit: Logical operation : Equals menu command to make a duplicate of event channel a in event channel b.
- Repeat to make another duplicate in channel c.
- Select the Event analyse: Event-triggered scope view menu command to open the Scope view dialog.
- Set the Sweep dur to 10, so that the entire artefact is visible in both traces.
We will set up a match for the extracellular artefact (trace 1) first.
- In the Scope view, set the Trig chan to b.
- Click the horizontal magnify button
(
 ) on the dialog toolbar, and carefully drag from just before the start of the artefact, to the time where trace 1 stabilizes after the artefact.
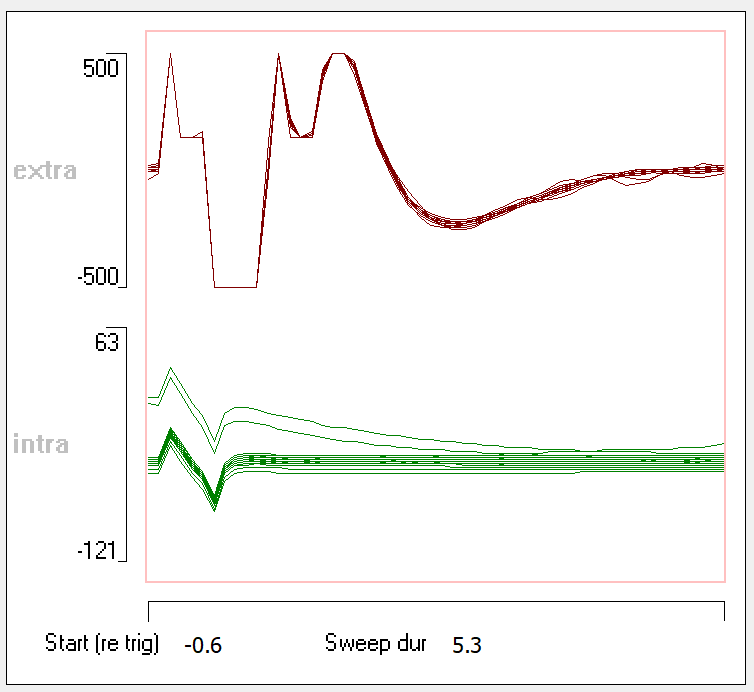
- Or set the Start (re trig) to -0.6 and the Sweep dur to 5.3.
- Click the Ev = Disp button at the top of the dialog, and dismiss the warning alert.
- This adjusts each event in the channel so that it has a start time and duration that matches the display in the Scope view.
Now we will match the intracellular artefact (trace 2).
- Set the Trig chan to c.
- Set the Start (re trig) to -1 to bring the whole artefact back into view.
- Drag the horizontal magnifier over the artefact in trace 2.
- Or set the Start (re trig) to -0.6 and the Sweep dur to 1.3.
- Click the Ev = Disp button at the top of the dialog, and dismiss the warning alert.
At this stage the events in channel b should match the artefacts in the extracellular trace, while the events in channel c should match those in the intracellular trace. We are now ready to attempt to remove the artefacts.
3: Remove Artefacts
- Select the Transform: Set data value in events menu command to open the dialog.
- The default target is trace 1, which is the extracellular trace.
- Click the Preview button in the dialog.
- This opens a Preview window. The upper trace shows the raw data, the lower trace shows the same data after the chosen transformation has been applied.
- Click the Show all button
() in the preview toolbar.
- Click the Horizontal magnifier
() in the preview toolbar, and drag over the first 3 artefacts in the preview display to zoom in.
- OR set the preview Start time to 80 and the Sweep dur to 115.
- Click the Gain up button
(
 ) in the preview toolbar three times.
You can now see the actual data between the artefacts, but the artefacts dominate the preview display.
There are 3 options in the dialog which are relevant to artefact removal: Interpolate between event start-end, Set to constant value and Subtract within-event average of source. We can try each of these options on the 2 traces.
Extracellular trace
- Set the Event channel ID in the dialog to b. Events in this channel match the artefacts in the extracellular trace 1.
The default option is Interpolate between event start-end. The effect is apparent in the preview; in the second stimulus in particular, the waveform within the artefact has a strong upwards slope to join the last datum before the artefact with the first datum after. This slope may not be thought appropriate.
- Select Set to constant value in the dialog.
- Note that the default value is 0, which is suitable for an AC-coupled extracellular recording.
Now the artefact is simply replaced by a straight line.
- Select Subtract within-event average of source. Note the new display that appears in the dialog. It will be explained below.
This is the most complex option. The underlying concept is to generate an artefact template by making a point-by-point average of the waveforms within each event, and then to subtract this template from the individual event waveforms.
To be effective, the following conditions must be met:
- All artefacts must have the same underlying shape, so that the actual data waveform during each artefact is the arithmetic sum of an identical underlying artefact waveform , plus the ongoing real data, which is likely to be different in each case.
- The ongoing data during the artefact should not itself be rigidly phase-locked to the stimulus, or it will get incorporated into the template and lost during subtraction.
- There should be lots of stimuli, and hence lots of artefacts contributing to the average, so that non-artefact waveforms are attenuated by the averaging.
The new display in the dialog shows the 30 event waveforms as grey traces, plus their point-by-point average in red. It is the red waveform which is subtracted from each event waveform.
The preview shows that this is fairly successful for this extracellular trace. However, there are a couple of points to note. First, the artefact is so large that its negative phase saturates the analog-to-digital converter (ADC) used in acquiring the data. This is apparent in the flat bottom of the negative peak. It also probably just saturates during the positive peak too. If the ADC saturates, then any real data occurring during the period of saturation is irretrievably lost. Second, the very first stimulus in the recording has a suspiciously large spike in it after artefact removal. It is not possible to be sure, but I suspect that the artefact waveform generated by the first stimulus in this recording was slightly different to that generated by subsequent stimuli.
Write Data
The "correct" choice of the three options depends on the data, but the safest is the second, since it does not risk introducing any new artefact into the data.
- Re-select Set to constant value in the dialog.
- If you have already written a new data file while constructing events above, then uncheck the Write new file box, else leave it checked.
- Click OK to transform the data and dismiss the dialog.
A new trace 2 is written which is identical to trace 1, except the waveform during the artefact has been set to 0. The gain on this trace can be increased to view the actual data, without the artefact dominating the display. You could select to replace the original trace rather than add a new trace, but you can always delete or hide the original trace later if you want, so keep the Add trace option selected at this stage.
Intracellular trace
The new extracellular trace has caused the intracellular trace to be shifted down, so that it is now trace 3 rather than trace 2.
- Select the Transform: Set data value in events menu command to re-open the dialog.
- Note that the default option Interpolate between event start-end is selected.
- Click the Preview button in the dialog.
- Click the Show all button
() in the preview toolbar.
- Set the Traces to process to 3 in the dialog.
- The preview should now show the intracellular trace
- Click the Horizontal magnifier
() in the preview toolbar,
and drag over the group of 3 spikes about one quarter of the way through the preview display to zoom in.
- OR set the preview Start time to 280 and the Sweep dur to 115.
- Set the Event channel ID to c.
The lower trace in the Preview window should now show the intracellular recording with the artefact removed. It is important to remember that this method reconstructs the waveform within the artefact by simple linear interpolation between the start and end, so there is no additional information content in this period. However, it does remove the visual distraction of the artefact from the display.
What about the other two options?
- Select the Set to constant value option. This is clearly innappropriate for an intracellular recording!
- Select the Subtract within-event average of source option.
- Set the Source trace (just below the Subtract option) to 3.
- The Source trace specifies the trace from which the average will be constructed. In this case this is the same as the Trace to process choice, but it does not have to be.
The template subtraction method also does a good job of removing the artefacts. For comparison, it is worth looking in more detail at the waveform.
- Click the Horizontal magnifier () in the preview toolbar,
and drag over the central spike in the group of visible in the preview.
This spike has an artefact sitting right on top of it.
- Switch between the Interpolate and Subtract dialog options,
and observe the changes in shape of the transformed spike in the preview.
- The Subtract option does a slightly better job in that it actually reconstructs the post-peak spike waveform, while the Interpolate option just draws a straight line through it. However, away from a spike the difference is fairly small.
- Click the page left button
(
 )
in the preview toolbar until the previous artefact comes into view, and compare the two options again.
)
in the preview toolbar until the previous artefact comes into view, and compare the two options again.
- With the Subtract option selected, check the Use draggable limit cursors box just below the option in the dialog.
- Two draggable blue lines appear in the dialog display showing the template. These act as limit cursors, and any event waveform that crosses these will be excluded from the average. The purpose is to be able to exclude any outlier waveforms that would excessively bias the average. However, with these data this has very little effect on the reconstructed waveforms in the preview, so leave the option unchecked.
Write Data
For the intracellular trace there are two viable options. The Interpolate option is the safest because it makes no attempt to reconstruct the detailed waveform within the artefact. However, with these data the Subtract option seems to work well, so leave it selected.
- Uncheck the Write new file box in the transform dialog.
- Click OK to transform the data and close the dialog.
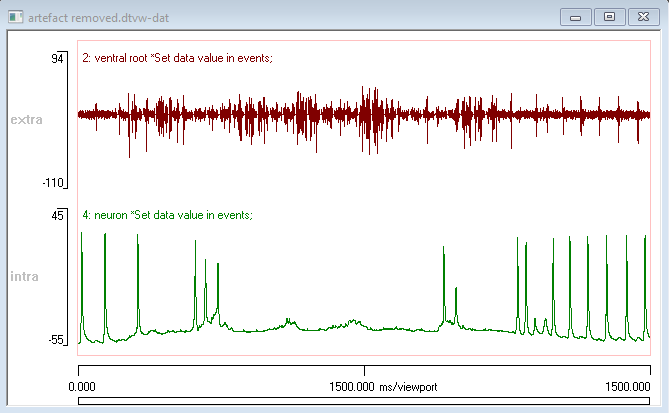
You now have a file with 4 traces. Traces 1 and 3 are the original data, traces 2 and 4 are the data after artefact removal. If you hide the original traces and event channels, the data should look like this:
Final Note
As with any manipulation of experimental data, the artefact removal process should be documented in any report that uses the data.