In the first section we looked at how measurement instruments can produce information. The information produced and processed by these systems will be in the form of a signal which carries a message (specific set of information). In the case of the grating spectrometer shown in figure 1.2 the signal was a voltage communicated from the light detector to the voltmeter. This voltage will vary in a specific pattern as the grating angle is altered. It's this pattern which carries the message.
All information handling systems have the same basic form. Firstly, there will be some type of information source. This can take many forms, from the microphone in a telephone to the keyboard of a computer. The source will be connected to a receiver by some sort of channel. In the case of a telephone, the receiver will be an earpiece in another telephone and the information carrying channel between them may be a set of wires. Information is sent along the wires in the form of a varying voltage and current which acts as a signal whose details carry the actual information or message.
In this set of pages we will tend to talk about signals being ‘transmitted’. Despite this it's important to realise that — from the theoretical point of view — there isn't any real difference between transmitting signals, storing them on discs/tapes/etc to read later, and processing them in a computer. Most of the basic comments and properties outlined here apply to information processing systems in general. They aren't restricted to telephones or TV broadcasts! For this reason the concept of signals is of fundamental importance to information theory. Before the invention of the telephone, people could send messages by posting written letters, or by getting a chain of other people to stand on hilltops and wave semaphore flags, or even by lighting bonfires! Before the desktop computer there was pen & paper. Modern systems are more convenient, but if you really wanted to you could do it some other old-fashioned way!
No matter how it's done, before a signal can be used to communicate some specific information in the form of a message, the sender and receiver must have agreed on the details of how the actual signals are to be used. Its not enough to agree that someone will stand on a hilltop and wave flags. We have to arrange that, “These flags held like this represent the letter ‘A’; these held like this represent ‘B’...”. i.e there must be some sort of pre-arranged code for sending the information. It is also clearly important that we can distinguish one code symbol (‘A’, ‘B’, ‘C’, etc are examples of distinct symbols) from another, otherwise we will make mistakes.
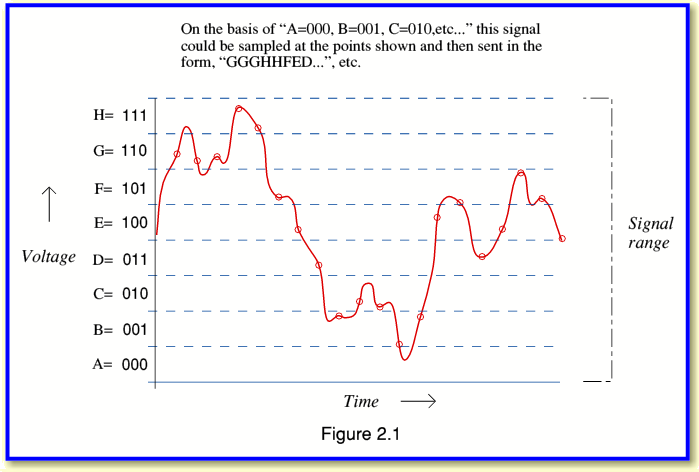
It's important to realise that the same message can be conveyed in any form we like provided we obey the basic rules of information theory. As an example, consider the message illustrated in figure 2.1. This shows a varying voltage coming from a sensor. At this point it doesn't matter very much where this pattern has come from or what it represents. It might be coming from a telephone mouthpiece and carrying information about what someone is saying. It might be from the light detector in figure 1.2 and indicates how the light level varies as the grating angle is altered. What matters is that the details of the signal pattern are the message which carry the information. In the case of the instrument shown in figure 1.2 the information is signalled from detector to voltmeter by a smoothly varying voltage whose level is roughly proportional to the detected light level. Signals of this type are called analog since the varying level (the voltage) is treated as a mathematical analog of the original (light power in this case) pattern. We can therefore imagine that the shape of the curve plotted in fig 2.1 holds the information about the spectrum of the light being observed.
If we wanted to communicate this information to someone we could connect up some amplifiers and wires and send it as an analog voltage level which varies as shown. (In this case, the various voltage levels which we can distinguish from one another are the ‘symbols’, although it's not normal for analog signals to be described in that way.) Alternatively, we can adopt other ways to communicate or store the same information. For example, we can choose to sample the signal waveform and convert it into a series of binary numbers. To do this we proceed as follow:—
We begin by defining a specific maximum signal range which is wide enough to ensure that the signal level is always inside the chosen range. We then choose a point on the waveform and ask, “Is the point in the top half of the range?”. If it is we write down a ‘1’, if not we write down a ‘0’. We then define a new range which only covers that half of the original one which contains the point and ask the question again to obtain another ‘1’ or ‘0’ answer. This provides a two-digit number which tells us which quarter of the original range the point occupies. In principle, this process of halving the range, asking the question, getting a yes/no answer, and noting the result as a one or zero can be repeated as many times as we like. We can then repeat this whole process for a series of points along the waveform. This process is called sampling the waveform. Note that if the signal level ever moves out of the initial signal range we've chosen we won't have any way of indicating it's actual level. Should this happen, the signal is said to have been clipped since we can only indicate its value by the nearest available set of ‘1’s & ‘0’s.
In the example shown in figure 2.1 the question & answer process is performed three times for each chosen point. This gives us a series of three-digit values which tell us which eighth of the signal range contains each sample. The result is a series of binary numbers whose pattern holds the information required to define or reconstruct the actual waveform. We could therefore transmit these numbers to someone and they could then use them to draw out the original waveform shape.
The process considered above converts the waveform information into a signal encoded in binary digital form. Digital numbers are very convenient to transmit and are ideal for storing and processing in modern digital computers. We can, however, encode the same information in any way we find convenient. For example, if we wanted to record in a notebook, we could represent each possible digital number as a letter. For example, as shown in the diagram, we could choose 000 = ‘A’, 001 = ‘B’, 010 = ‘C’, etc. The information in the waveform could then be written down as ‘GGGHHFED...’. It doesn't matter what form of code we choose. Provided we have encoded it correctly, the same information will be preserved. The message will remain the same although the form of the signal used (analog voltage, digital numbers, letters in a book) will be different.
2.2 How much information in a message?
In the above example we asked three yes/no questions about each chosen point on the initial waveform. Yes/no questions like this are the simplest we can ask. Each answer is a yes/no or ‘1’/‘0’ which gives us the minimum possible amount of extra information. This minimum possible quantity of information is called a bit. Having asked three yes/no questions per point we therefore obtain a series of values, each of which contains just three bits worth of information. In general, asking n questions per sample produces a series of n-bit binary numbers, each of which defines which  th of the signal range each point occupies. There are only
  possible n-bit numbers. Hence we require
  distinct symbols (‘A’, ‘B’, ‘C’,... ‘H’ or ‘000’, ‘001’, ‘010’,... ‘111’, or whatever) to convey the information. The limited range of possible values means we can use a limited ‘alphabet’ of
  symbols.
The amount of information we collect about the waveform depends upon how many points we sample and how many yes/no answers we get for each. We can therefore hope to get twice as much information by taking double the number of samples. However, although asking an extra question per sample doubles the number of symbols required it doesn't provide twice as much information. In the example considered above, asking an extra question per sample would mean each binary result would have four bits instead of three. This means we would collect 4/3rds as much information not twice as much! The basic rule of information theory is that the total amount of information, H, collected will be
where N is the number of samples & n the number of bits (questions & answers) per sample. Given an initial signal which last for a period of time, T, sampled at a series of instant t apart, this means that we'd obtain a total amount of sampled information
where  is the number of symbols available to convey the message.
In practice, the amount of information we can communicate in a given time will be limited by the properties of the channel (the wires, amplifiers, optical fibres, etc) we use. We therefore often need to know the information carrying capacity of a channel to decide if its up to a given task. Consider the example of a varying analog voltage sent along some wires to be measured with an Analog to Digital Convertor (ADC). Here the wires are the channel and the ADC is the signal receiver. How many bits worth of information could an ideal ADC obtain from the analog signal in a given time? The input seen by the ADC will be a combination of the transmitted signal level and a small amount of random noise. This determines the size of smallest signal details we can expect to observe. There will also be a limit to how great a signal voltage can be transmitted without ‘clipping’ or serious distortion. For the sake of example, let's assume that the channel has a noise level of around 1 mV and can handle a maximum range of 1 V.
Ideally, the ADC's range should equal that of the input channel. i.e. the ADC should in this case start with a voltage range,  of 1 Volt. An n-bit ADC could then determine the signal level at any instant with an accuracy of
  . An 8-bit ADC could divide the input 1 Volt range into
  bands, each
  Volts wide, and determine which of these bands the input was in at any instant. A 10-bit ADC could divide the 1 Volt range into
 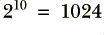 bands, each
  Volts wide. We might therefore expect to extract more information and obtain an more accurate result by using a 10-bit ADC instead of an 8-bit one. However, if we tried using an even better ADC giving 11 or more bits per sample we wouldn't obtain any extra information about the signal. This is because the 10-bit ADC already divides the input range into bands just 0·97 mV wide — i.e. slightly smaller than the amount by which the random noise jitters the input up and down. There's no point trying to determine the voltage level more accurately than this. We'll simply be looking at the effects of the noise. So it would a waste of effort to use an 11-bit ADC in this case as the ‘extra’ bits wouldn't tell us anything useful.
This effect arises because the input signal has a finite dynamic range — the ratio of maximum possible signal size to the minimum detail detectable over the random noise. The dynamic range, D, of an analog signal is defined as a power ratio given in decibels between the maximum possible signal level and the mean noise level. i.e. we can say that
where  and
and  represent the rms maximum signal and rms noise. This dynamic range should be distinguished from the actual signal to noise ratio, at any time
where  is the actual signal power level which is usually
  .
.
There will also be a limitation on how quickly the voltage being transmitted along the wires can be changed. This is due to the finite response time of any system. Here, for example, we can assume that (due, perhaps to stray capacitances) the wires take a microsecond to react to a change. This means we can't expect to obtain any extra information by making the ADC sample the input it sees more often than once a microsecond. i.e. choosing a sampling rate above 1MHz (106 samples per second) won't provide any extra information.
If it takes the channel (the wires) a microsecond to respond to a voltage rise and a microsecond to respond to a fall, the highest signal frequency we can expect it to carry will be one cycle (one up & down) every two microseconds — a maximum signal frequency of 0·5 MHz. The bandwidth of a channel is the range of frequencies it can carry. In most cases we can assume that this range extends down to ‘d.c.’ so the maximum frequency and the bandwidth usually have the same value. In this case we see that the sensible sampling rate is about 1 MHz and the bandwidth of the analog channel is 0·5MHz. This implies that, in general, we can expect the required sampling rate to be double the bandwidth.
In this case, the combination of 1 mV of noise, a signal voltage range of 1 V, and a 1 microsecond response time mean that there is no point in using an ADC which tries to collect more than 10 bits per microsecond. It is important to note that this limitation of the rate the ADC collects information is imposed by the channel which transmits the analog signal to it, not a defect of the ADC itself. A better ADC wouldn't give us any extra information since 10×10 bits per second is all this particular analog signal channel can carry. The analysis we've carried out here is just a rough approximation. We'll be considering the question of the information carrying capacity of a channel more carefully in a later section. However, we can already see that the effects of random noise, clipping, and response time/bandwidth combine to limit the information carrying capacity of any information channel no matter what form of signal it uses.
Summary.
In this section you saw how all information processing systems can be regarded as consisting of an information source connected to a receiver by some form of channel. That the any particular set of information is a message which is sent as a signal pattern using some form of code made up of appropriate symbols. You saw how an analog (continuously varying) signal can be sampled to recover all the information it contains. That the amount of information a channel carrying an analog signal can convey is finite, limited by the biggest unclipped level it can manage (clipping), the noise level, and the time it takes to respond to a changed input ( the channel's response time or bandwidth).
Content and pages maintained by: Jim Lesurf (jcgl@st-and.ac.uk)
using
TechWriter Pro and HTMLEdit on a RISCOS machine.
University of St. Andrews, St Andrews, Fife KY16 9SS, Scotland.