
DataView can display multiple data files simultaneously within an enclosing main programme area. For each file it can provide three main "views" of the data: Chart View, Scope View and Matrix View.
The chart view is the core view, and is always present. It is the hub from which other views and further analysis are controlled.
The scope view acts like an event-triggered oscilloscope, in which the trigger events are detected from the data or inserted manually or algorithmically. Sweeps can be superimposed, averaged, and analysed in numerous ways.

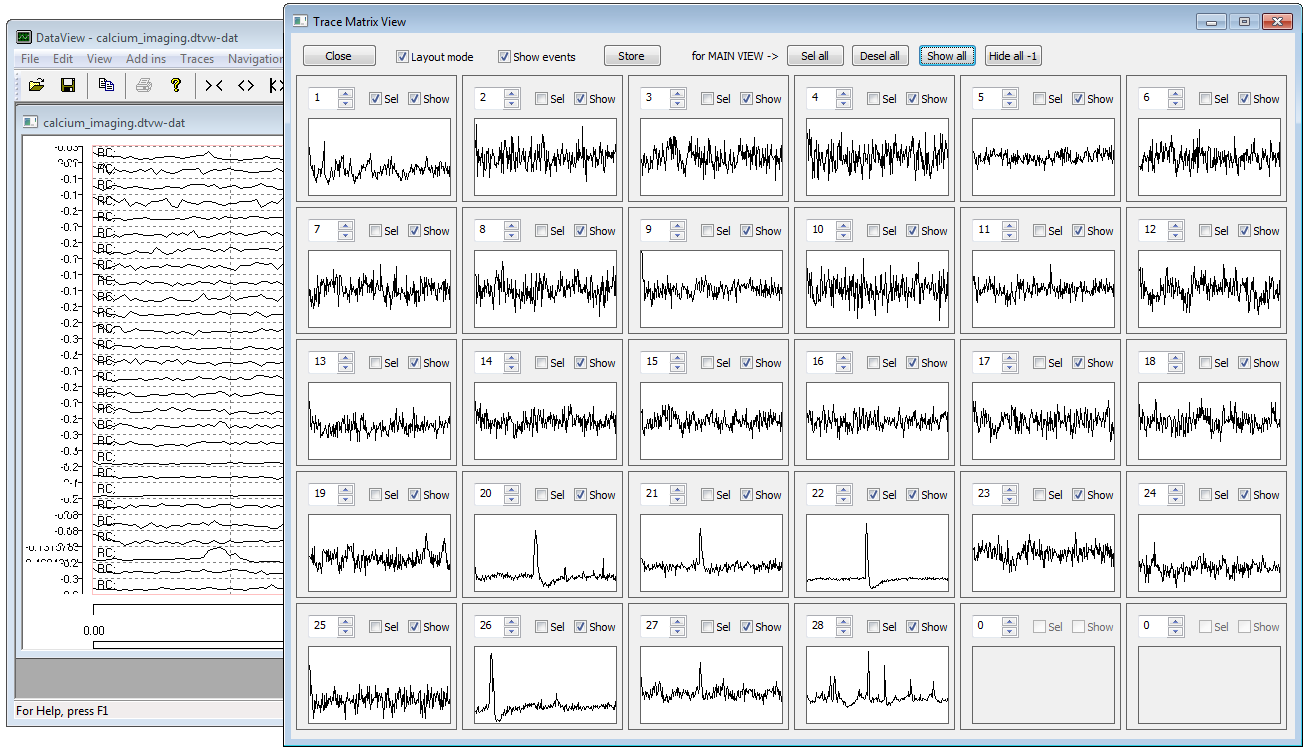
The matrix view displays a rectangular array of cells, with each cell containing an individual data trace (channel). This is a useful way of displaying recordings containing many traces (like multi-electrode array [MEA] recording), when the standard chart view is hard to interpret. The dimensions of the matrix can be configured by the user, as can the identity of the trace displayed in each cell. This enables the display to reflect the sensor layout in MEA or similar recordings. The trace in each cell is a clone of its partner in the chart view, and its gain and position are controlled by the latter.
DataView can export graphics in high resolution EPS, SVG and HPGL formats, as well as screen resolution WMF format. These are all vector formats that can be read by specialized graphics programmes for incorporation into publication-quality figures. User-specified scale bars can be included in the export so that these can be re-scaled with the data and included directly in the figure if desired.