DataView has sophisticated facilities for recognising and analysing waveform events such as nerve spikes. These operate in a highly interactive manner, making it easy for the user to fine-tune event recognition while seeing the immediate changes in both the main display and analysis displays such as graphs and histograms.
There are two primary modes of automatic event recognition: template matching and threshold crossing. Events can also be added manually or algorithmically in a variety of ways.
Template matching has three sub-modes - using a fixed template, using an adaptive template, or using an optimally scaled template.
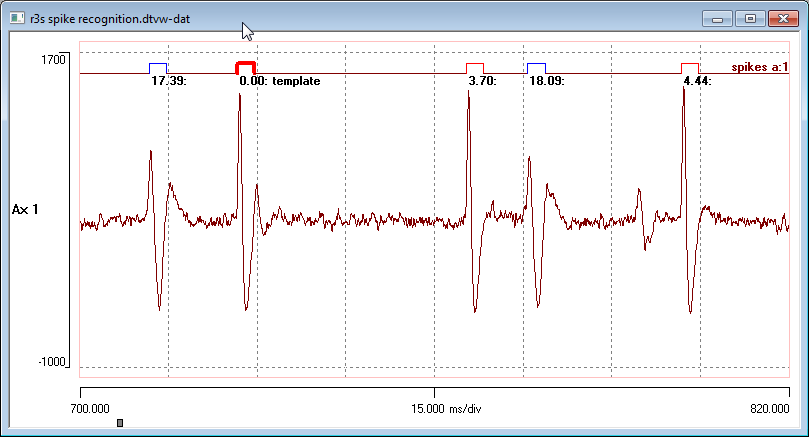
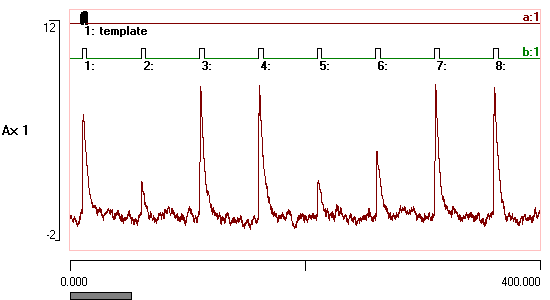
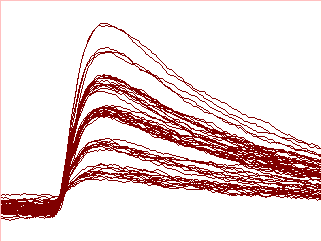
A user-defined segment of waveform is captured as a template, and then the recorded trace is scanned for waveforms that match the template within a user-specified error range. Recognised events can be averaged and used as a new template to refine recognition criteria.
Adaptive template matching is like fixed template matching, except that the template adapts itself to systematic changes in the waveform such as a gradual decrease in overall amplitude. The adaptive template works by replacing the original template with a running average of the waveforms of recently-recognised events. The number of events constituting the average is determined by the user (typically 8), and as each new event is recognised, the earliest event in the average drops out to be replaced by the most recent. If an average of 1 is selected, then the template is successively replaced by each identified event, so that each found event constitutes the template for the next event search.
Optimally scaled template matching is used when the intention is to find data elements of a particular shape, irrespective of their amplitude or dc-offset. A user-defined segment of data showing a waveform of the desired shape is first captured as a template. The record is then scanned on a point-by-point basis, and at each point the normalised template is scaled and offset to produce the best fit to the record. If the goodness-of-fit of this scaled template is within the acceptance criterion, it is counted as a match. The goodness-of-fit is defined as the scale factor divided by the standard error between the scaled template and the actual data.
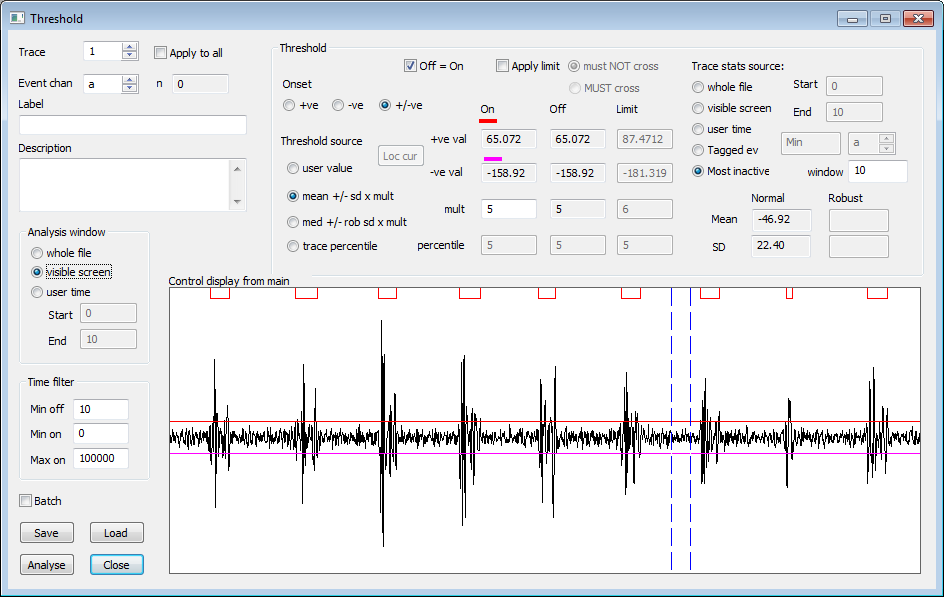
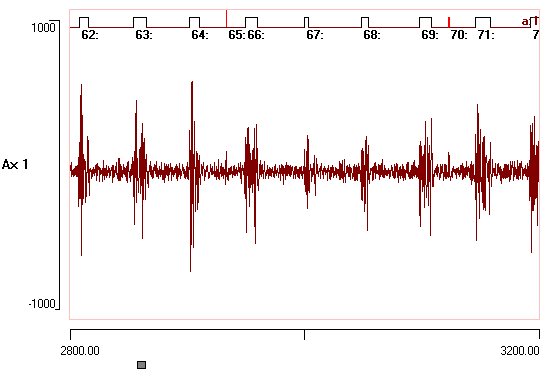
Onset and offset voltage thresholds can be defined either visually by cursors, numerically, or from the statistical properties of the data. Events are recognised as waveform segments that lie on one side or the other of the thresholds. Minimum on- and off-times can be specified, so that brief waveforms "glitches" are not accepted as genuine events. Limit cursors can be specified to exclude artefacts.
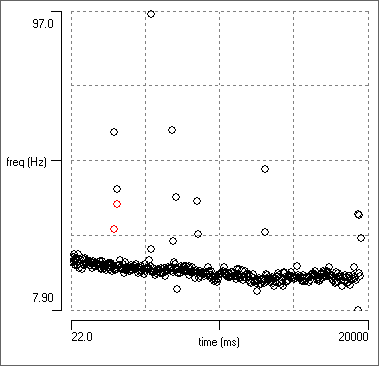
Finding the best recognition criteria to minimise mismatches of events with data can be quite time-consuming. In Dataview, this process is highly interactive. The programme can measure a wide range of event parameters (e.g. time of occurrence, frequency, duration, error [as above], peak amplitude, peak width, principal components etc.) and these can be plotted against each other in a scattergraph. This often allows outlier events to be easily identified. These can either be deleted by selecting them directly from the graph, or the display can automatically centre a selected event so that the user can decide what to do. The graphs update automatically as events are added or deleted.
Export
All event parameters and the underlying channel waveforms can be exported
in a format suitable for entering into a spreadsheet for further analysis.
Principal component or wavelet analysis
The principal components or wavelet coefficients of the waveforms comprising
each event can be determined.
Graphic display
The main univariate (interval, peak-to-peak amplitude etc) and bivariate (phase,
latency) event parameters can be displayed as a histogram, or plotted one
against the other as a 2D scattergraph. Clicking on a point in the scattergraph
centres that point in the main display.
Clustering
A rotatable 3D scatter graph view of event parameters such as principal components
aids manual or automatic clustering.
Point process
Normal events with variable durations can be turned into point process events
with minimal durations, located at the start, end, middle or "center
of gravity" of the parent event.
Bursts
The "Poisson surprise" method can be used to detect bursts within
event lists.
Interval prediction
The user can check whether the phase of a cyclic oscillatory activity detected
as a series of events has been reset as a result of an experimental perturbation.
Edit waveform
The data of channels within the events can be set to user-specified values.
This can be used to remove major artefact "glitches" from waveforms.
Averaging
The data of channels within the events can be averaged, and saved as a new
data file. Thus stimulus-evoked responses can be averaged, if some stimulus-locked
data feature is used to generate events.